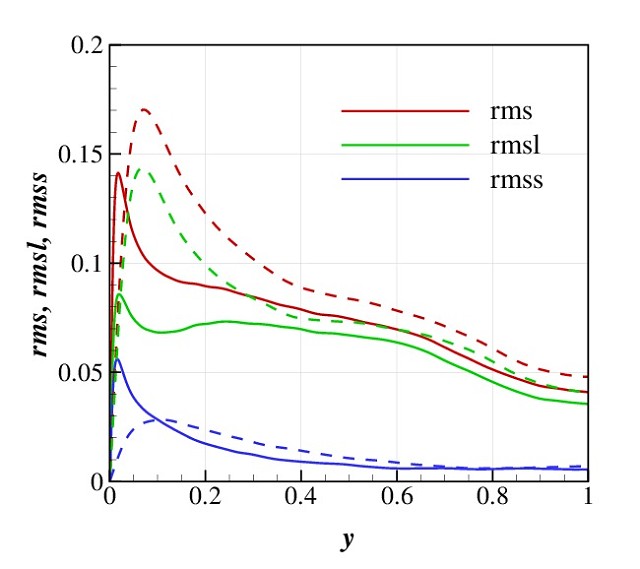
decomposed urms profile
This is a plot to show the u velocity fluctuation (urms) value in a turbulent channel flow. The solid lines are for Ret=200, while the dashed lines are for Ret=800. Ret is a very important non-dimensional number, and it describes the ratio of the outer scale and the inner scale.
The red line is the classic urms plot, with a peak value at y+=14 (in wall unit). By using Fast Fourier Transform, this plot can be decomposed into two parts: one is the very large scale structure (green lines); the other one is the small scale structure (blue lines). It is well know the inner peak of the red lines are scaled in inner units, so are the blue lines. The very large scale structure has a bigger contribution to the red line at higher y value, and the platform tends to be scaled in outer units.
63
views
- 0
- 0
Comments
Sign in or get an account to comment.


