inner outer peak
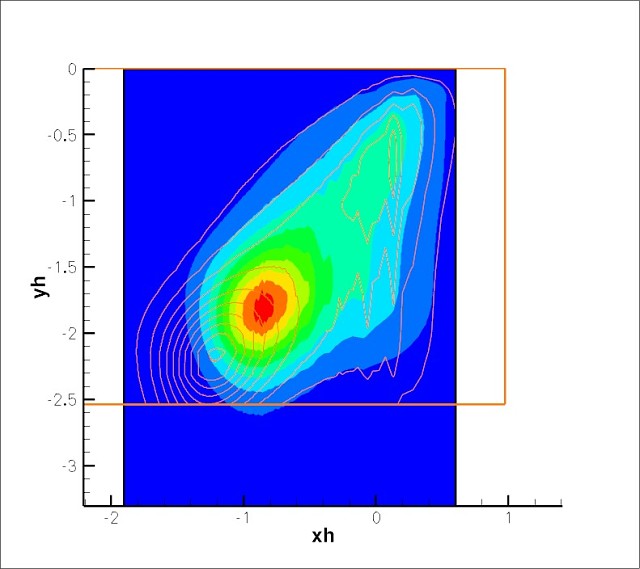
The spanwise energy spectra changing with channel height y is shown in the plot. The contour is for Ret=800 (our data), and the line represents Ret=2003 case from Jimenez. The two peaks seem to be obvious in this plot. The two axises are scaled in global units on purpose and shown in log scale. Because the outer peaks from the two Reynolds number tend to overlaid with each other at y around 0.2h. This is where the super scale structure exists.
41
views
- 0
- 0
Comments
Sign in or get an account to comment.


