
Barograph
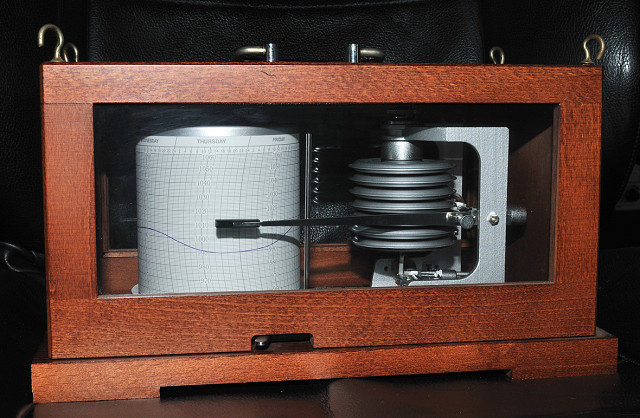
The storm of last week was predicted of course, calculated by computer models, seen by satellites and recorded by ocean data buoys, days and days before it passed us. In earlier days, it wasn't so easy. Seamen had very limited indicators of upcoming adverse weather. A few of them are still used however and regarded very reliable and useful. The first set predictors of them are delivered by Mother Nature, the clouds, a backing wind, a red sunrise, a pattern in the confused swell, resting seabirds and more. The second set is man made and are just as reliable; the barometer and barograph. Both are more or less the same, the barograph shows the actual air pressure where the barograph also writes down the trend. How it works? You'll be surprised how easy. See the folded steel box to the right? It is an airtight box, closed and sealed when the pair pressure outside was normal. When the air pressure drops, the difference in pressure expands the box. The visible arm with a pencil is connected moves with the expansion and writes down the difference. On the paper you can clearly see the pressure drop of Wednesday late, the passage of the low pressure and the rising of air pressure again. It always works.
794
views
- 1
- 0
- Nikon D300
- 1/50
- f/11.0
- 29mm
- 200
Comments
Sign in or get an account to comment.


